TMCV: Strong Business, Falling Chart. What Next?
India
June 11, 2026
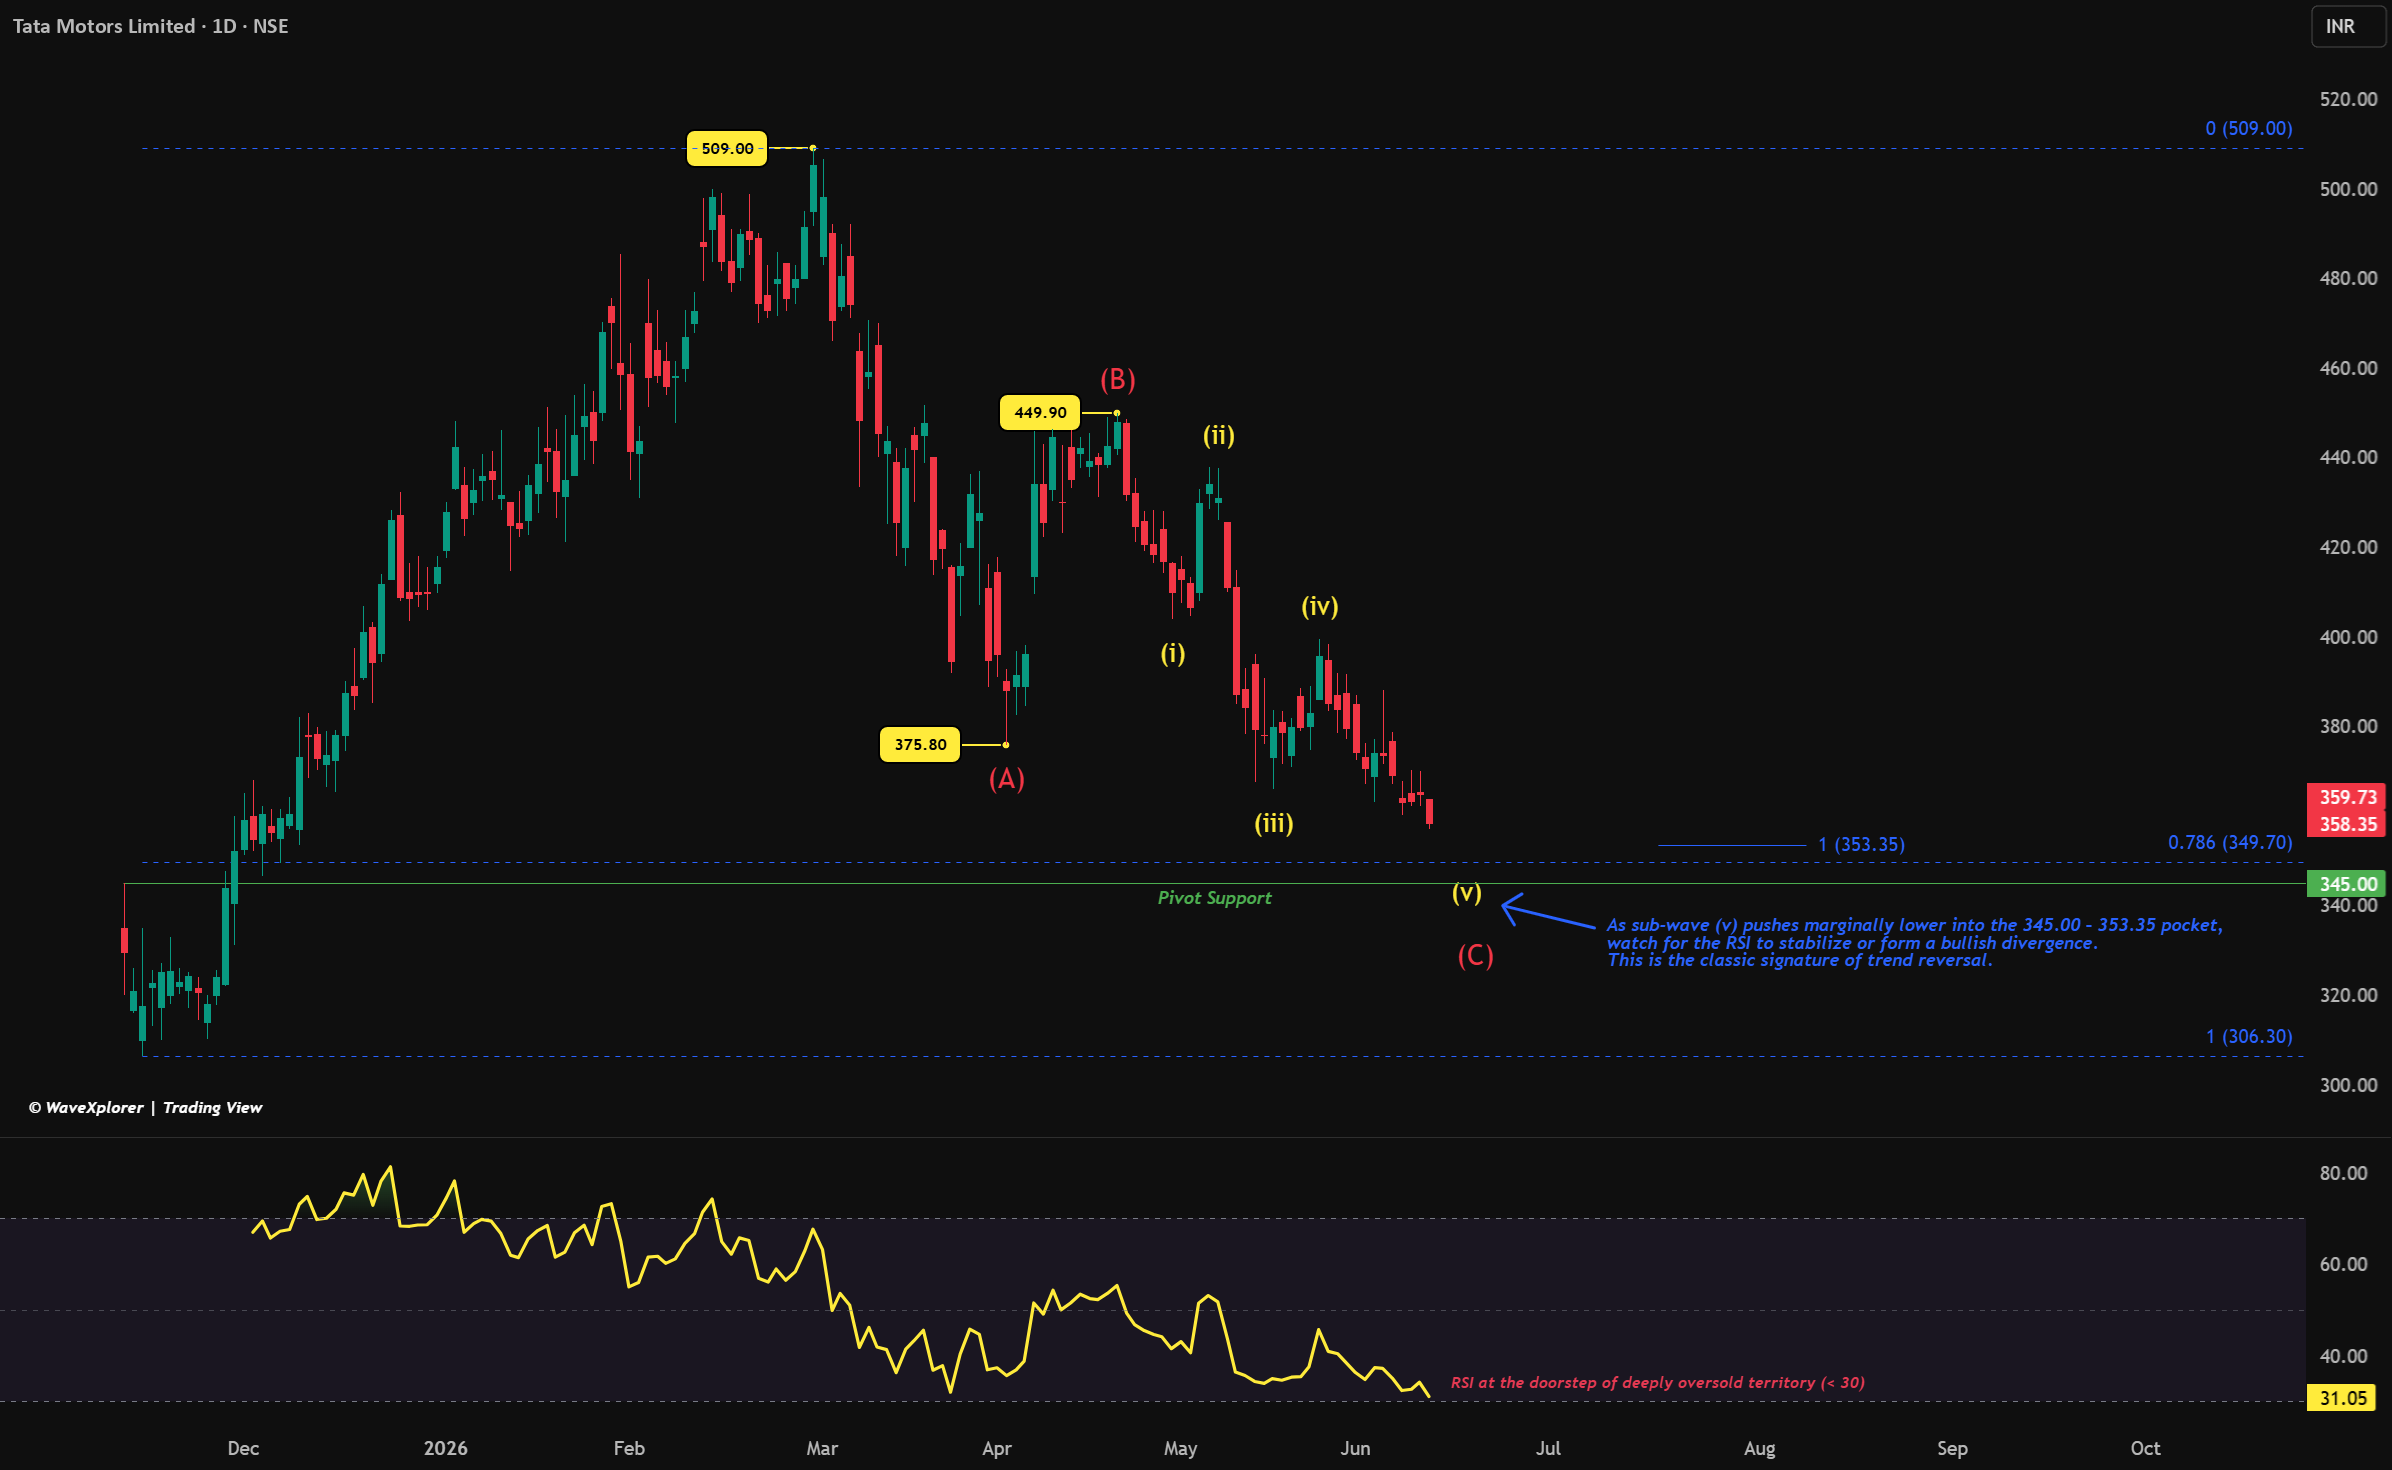
Tata Motors Commercial Vehicles (TMCV) has been in a steady downward correction since peaking at 509.00. Interestingly, while the company's underlying business remains healthy—showing strong double-digit sales growth and solid quarterly earnings—broader market pressures like rising oil prices have continued to weigh on the stock. This drop has brought the price down to a very specific technical area where multiple chart patterns meet. Here is an objective, step-by-step look at the current structure. The Elliott Wave Pattern When looking at the market cycle, the decline from the peak looks like a standard three-wave correction, labeled as (A), (B), and (C). At the moment, the price is moving through the final stages of the downward Wave (C). Specifically, it is within the fifth sub-wave. In wave theory, these final sub-waves often represent the final phase of selling pressure before a trend settles. A Three-Layer Support Pocket Instead of just one single line on the chart, three completely different technical tools are pointing to the exact same price zone between 345.00 and 353.35 . This creates a strong area of interest: Wave Projection: The mathematical target where the current down-wave equals standard targets sits at 353.35 . Fibonacci Retracement: Drawing a line from the major low up to the 509.00 peak shows that the deep 78.6% retracement level sits at 349.70 . Historical Pivot: A major horizontal support line where buyers have stepped in previously sits at 345.00 . RSI and the Ex-Dividend Factor The Daily Relative Strength Index (RSI) is currently reading 31.05, meaning the stock is right on the edge of becoming deeply oversold. There is also a corporate action to keep in mind. The stock goes ex-dividend on June 12 for ₹4 per share. This means the stock price will automatically adjust downward by ₹4 at the market open. This mechanical drop could push the price right into our highlighted 345.00–353.35 support zone. As this happens, we want to watch if the RSI begins to flatten out or show signs of stabilizing, which would indicate that selling momentum is slowing down. Where the Analysis Fails (Invalidation Level) No chart pattern is guaranteed to work, and risk management is the most important part of trading. If the market faces severe pressure and the stock finishes with a decisive daily close below 340.00 , this entire outlook is invalidated. A clear break below 340.00 means the down-wave is stretching longer than expected. In that scenario, the correction could deepen further toward the 300.00–315.00 range, and the idea of immediate support should be discarded. Disclaimer: This post is for educational purposes only and is not financial advice. I am not a SEBI-registered analyst. Please do your own research and manage your risk carefully.